

📊 Data, Charts and Hands-On Maths Fun!
- Adele Lord

- May 22
- 1 min read
This week in Maths, we have made a fantastic start to our new Data topic, with students exploring different ways to collect, record and present information through practical and engaging activities.
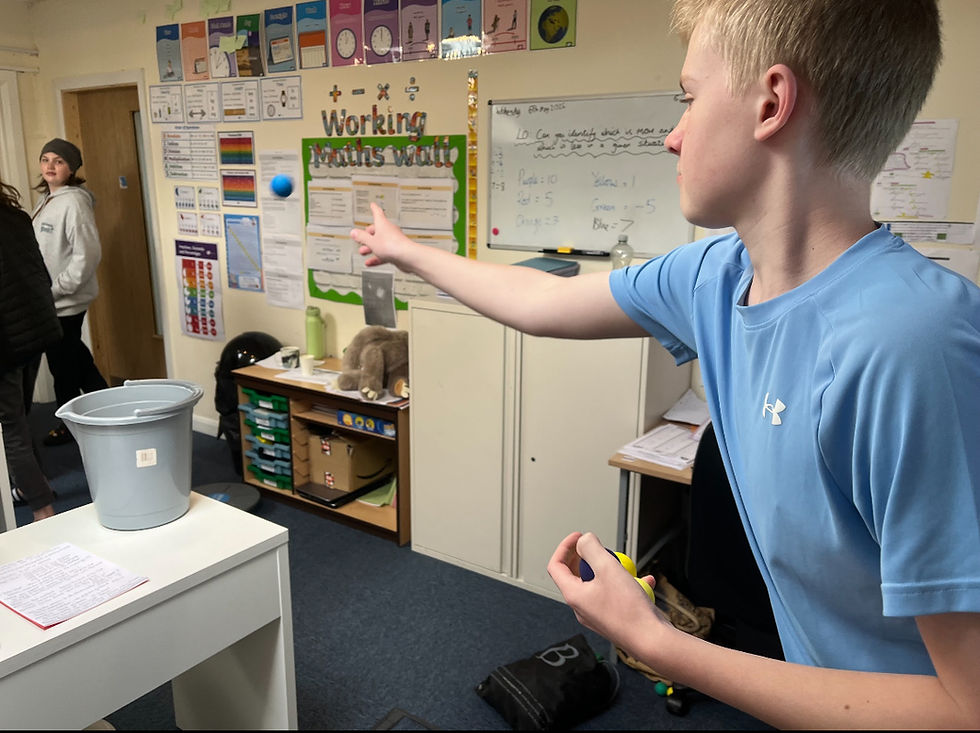
Learners used tally charts to record how many different coloured ping pong balls they could successfully throw into a bucket. This gave students the opportunity to gather real data before discussing results and identifying patterns.
We also created vertical line charts using staff shoe sizes collected from around our shared spaces. Students carefully recorded the information using tally charts before plotting their findings, making great links back to previous learning and developing confidence in handling data.
To finish the week, students explored bar charts through some very enjoyable hands-on activities. Using coloured blocks to physically build charts before transferring them onto paper helped learners visualise data clearly. A biscuit tasting activity also added a fun twist, with students collecting and presenting their results using mathematical skills in a real-world context.
It has been brilliant to see students so engaged, using practical experiences to strengthen their understanding and confidence while having lots of fun along the way! 📈✨


Comments